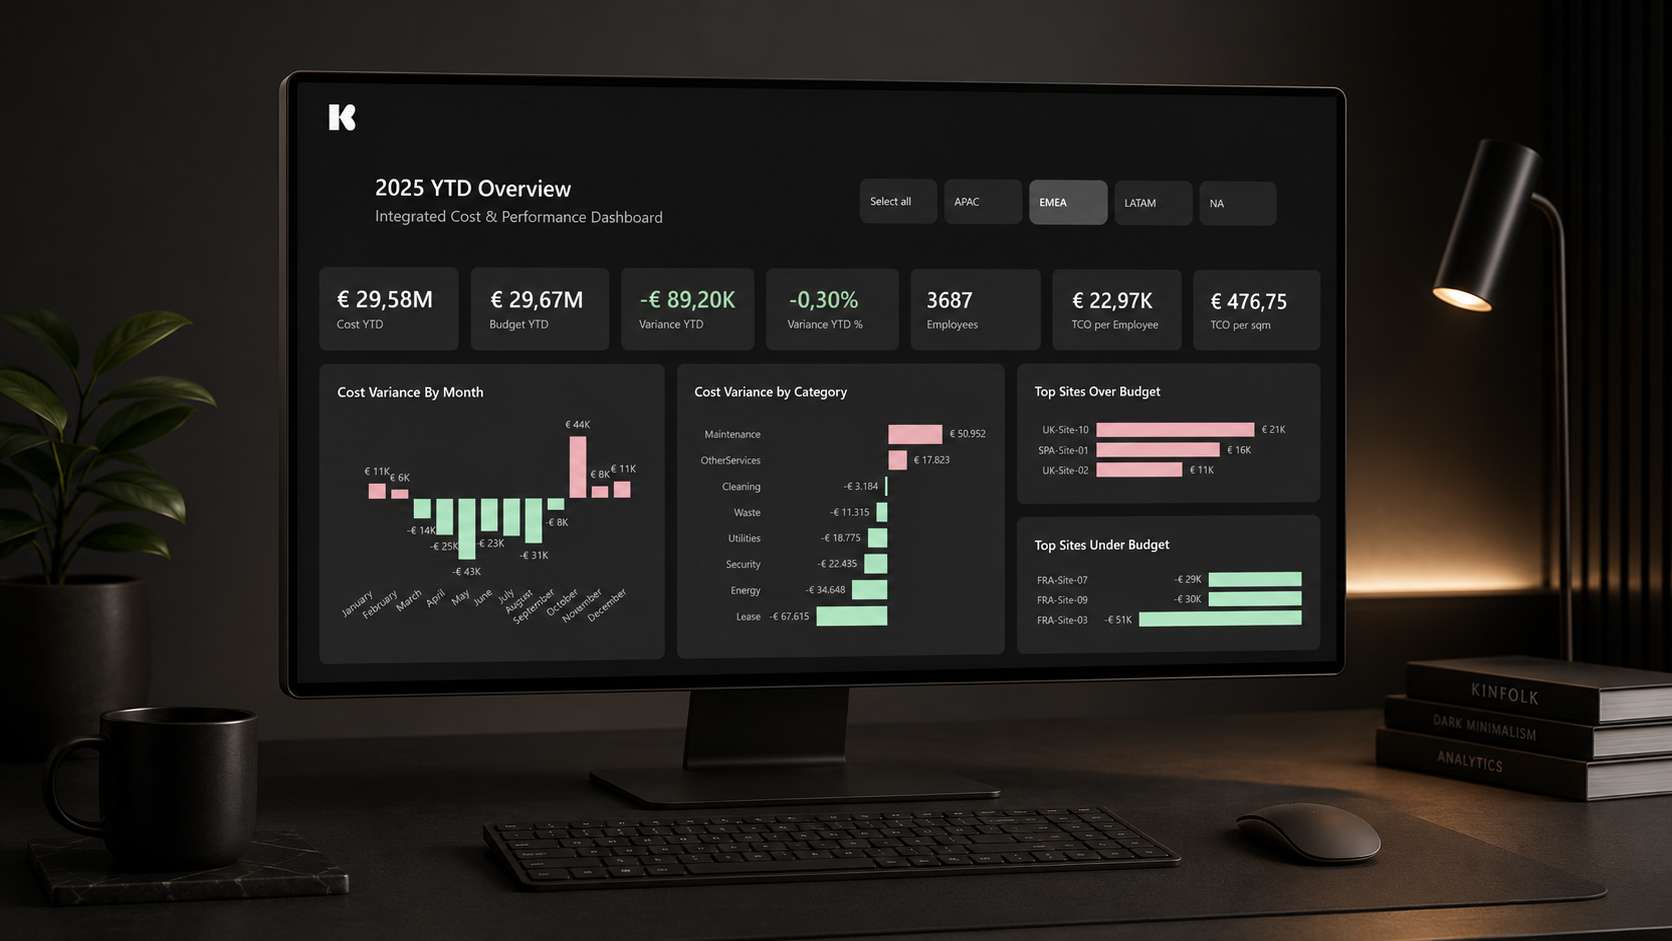
Kenvue's Real Estate function manages vendor relationships and service contracts across 10 manufacturing and distribution sites globally. With contracts spanning multiple categories — from facility services to building automation and security — the team needed a structured way to monitor the supplier portfolio, track contract lifecycle, and anticipate renewal risks before they became operational issues.
To support this need, I designed a Power BI dashboard focused on vendor performance, contract value visibility, and proactive risk management. The goal was to move the RE team from scattered contract data to a clear, decision-ready view of the entire supplier ecosystem.

Managing vendors across multiple sites and regions involves tracking several dimensions simultaneously: contract values, expiry timelines, payment status, supplier KPIs, and renewal priorities. The main challenge was not just aggregating this data, but structuring it in a way that allowed the team to act quickly and with confidence.
Key reporting needs included:
The dashboard had to serve both an executive audience — needing a high-level portfolio view — and an operational one, requiring enough detail to manage individual vendors and contracts.

I worked on the project as a Power BI and data management specialist, covering the full analytical and design workflow.
My contribution included:
The result was a Vendor & Contract Management Dashboard structured across three pages, each addressing a distinct business need.
The dashboard combines:
This structure allows stakeholders to move quickly from strategic overview to operational detail:

The dashboard is organized into three pages. The Executive Overview provides a portfolio-level summary with spend trends and contract status. The Vendor Performance page scores every supplier across delivery, quality, and compliance KPIs, enabling direct comparison and trend monitoring. The Contract Risk & Renewal page combines a risk matrix and expiry timeline to help the RE team prioritize renewal actions before contracts lapse.
From a business perspective, the dashboard supports several critical decisions:
Rather than functioning as a static report, the dashboard is designed as a proactive management tool — built to surface risk before it becomes a problem.
Have an idea or a challenge to solve? Tell me about it, and I'll personally get back to you.