Kenvue’s Real Estate function needed a clearer way to monitor year-to-date costs, compare actuals against budget, and identify the main drivers behind portfolio performance across multiple regions.
To support this need, I designed a Power BI dashboard focused on cost visibility, variance analysis, and site-level performance tracking. The goal was to create a reporting tool that could help stakeholders move from fragmented data to a more structured, decision-ready view of the portfolio. This work is aligned with the Real Estate reporting experience described in my CV, where I supported end-to-end Power BI solutions, dashboards, and KPI monitoring for Kenvue’s Real Estate division.
Real estate reporting often involves multiple dimensions at once: geography, site performance, cost categories, budgets, utilization metrics, and operational KPIs. In this context, the main challenge was not just visualizing data, but organizing it in a way that made complex information easy to read, compare, and act on.
Key reporting needs included:
The dashboard had to balance executive clarity with enough analytical depth to support operational follow-up.
I worked on the project as a Power BI / reporting specialist, with responsibilities covering both analytical structure and dashboard design.
My contribution included:
The result was an Integrated Cost & Performance Dashboard designed to give stakeholders an immediate view of portfolio health and cost performance.
The dashboard combines:
This structure makes it possible to move quickly from a high-level overview to more specific operational questions:
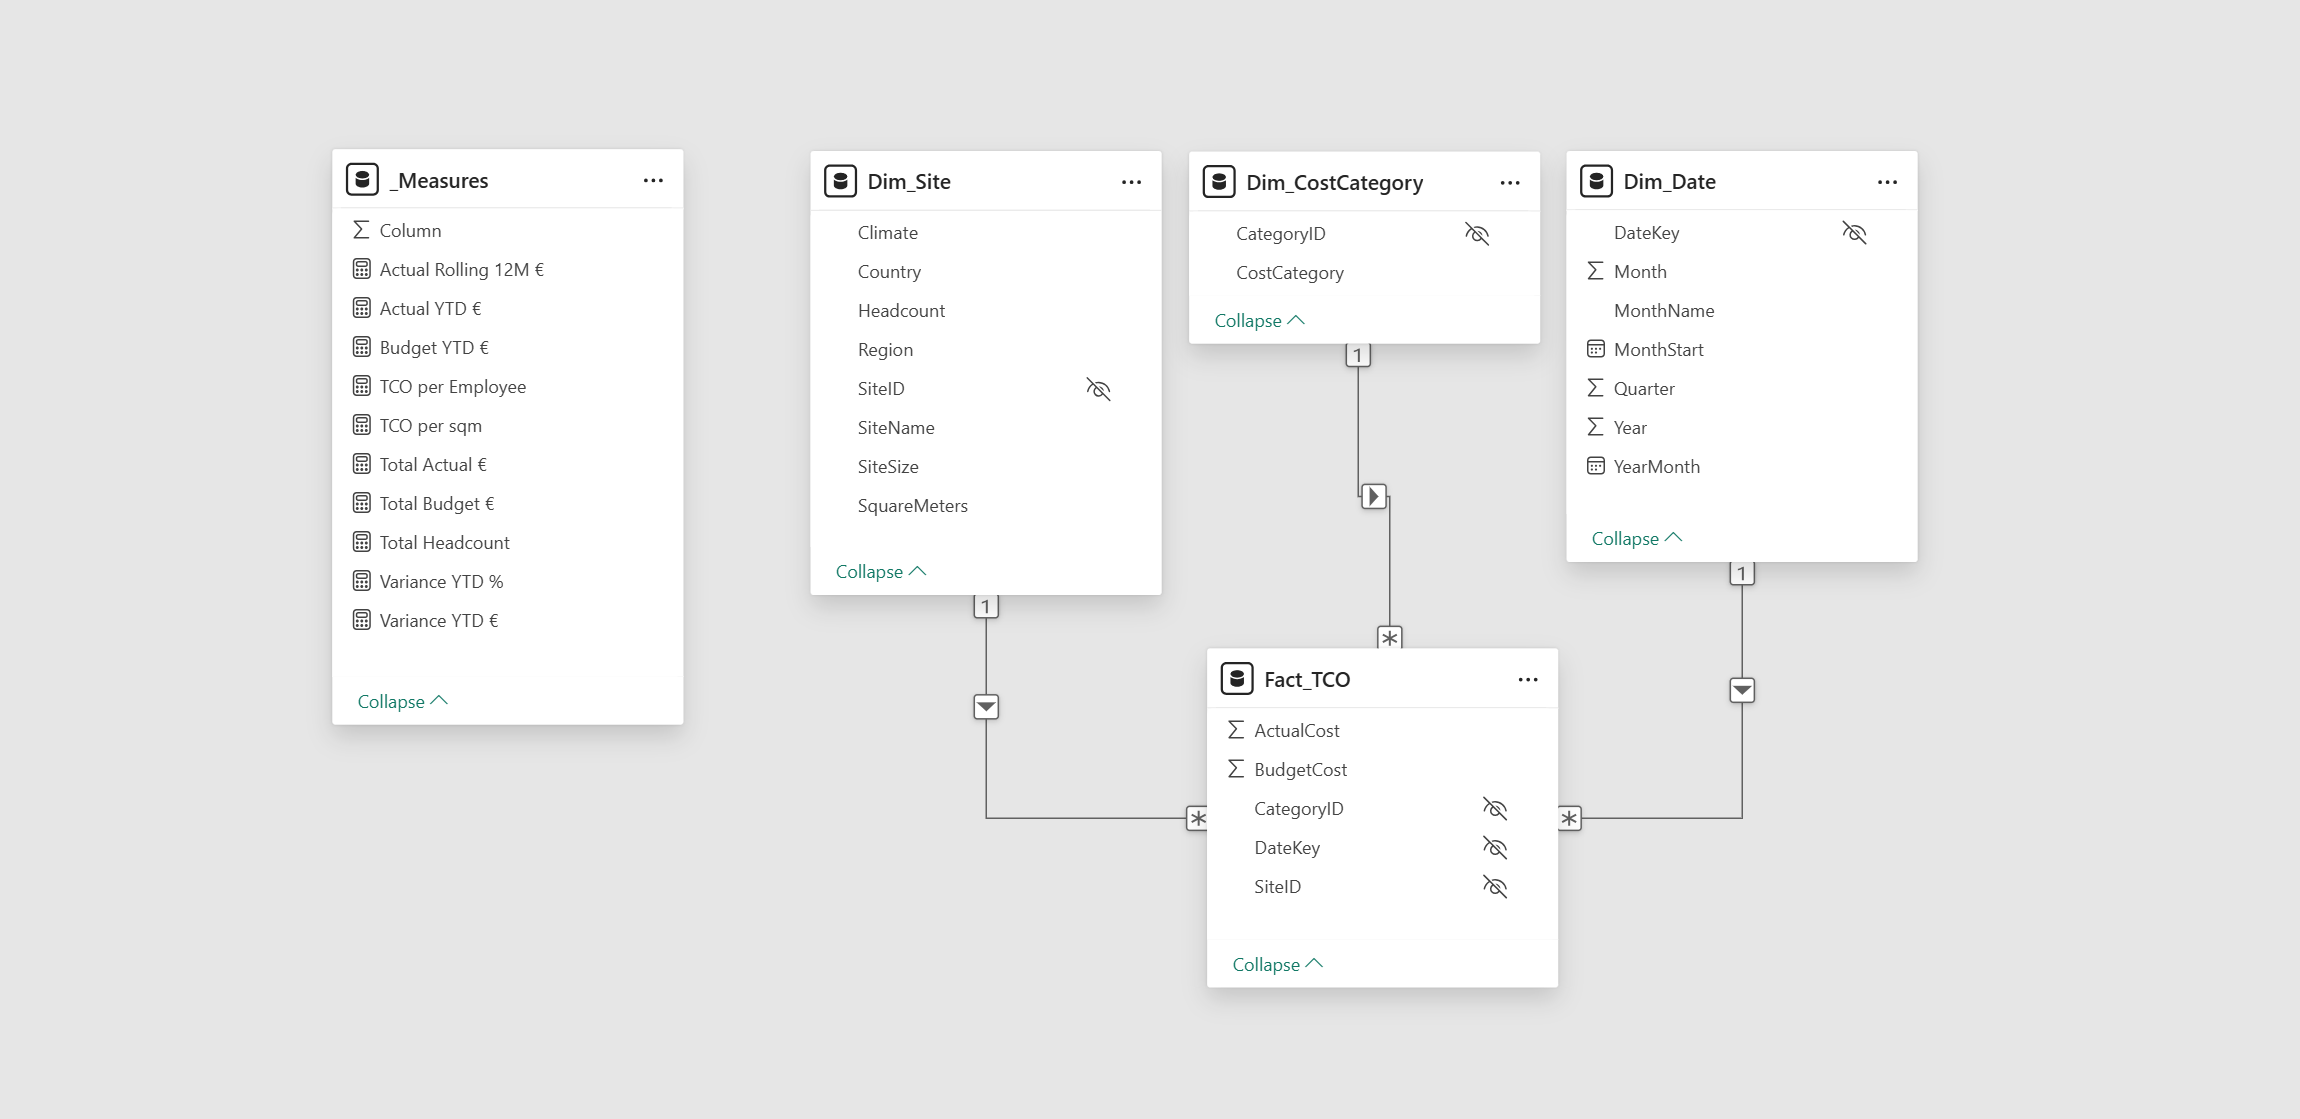
The dashboard is structured to give stakeholders a clear, decision-ready view of real estate portfolio performance. It starts with an executive KPI overview showing key year-to-date metrics such as cost, budget, variance, employees, and efficiency indicators. Regional filters allow users to switch between global and regional views, while variance is analyzed both over time and by cost category to highlight trends and key cost drivers. Finally, site-level rankings make it easy to identify the locations that are most over or under budget, helping teams prioritize attention and action.
From a business perspective, the dashboard supports several important decisions:
Rather than functioning as a static report, the dashboard is designed as a decision-support tool.
Have an idea or a challenge to solve? Tell me about it, and I'll personally get back to you.