BETTING CRM — Player Analytics & Campaign Performance Dashboard

Date Icon
2024
Power BI Development
CS Image
Client
NDA
Service
Power BI Development
Industry
Online Betting
live version
live version
Arrow

Overview

A betting operator needs visibility into player value, campaign effectiveness, and platform performance to drive retention and revenue. Player behavior across betting activity, deposits, and bonus usage is fragmented across raw transactional data, making it hard to answer basic CRM questions: who are the most valuable players, which campaigns actually convert, and where is revenue leaking.

To address this, I designed an end-to-end analytics pipeline on Snowflake feeding a Power BI dashboard focused on player segmentation, campaign ROI, and revenue health (GGR/NGR). The goal was to give CRM and marketing teams a decision-ready view of player lifecycle and campaign performance, from acquisition to retention.
The Challenge

Betting platforms generate dense, fast-moving transactional data: stakes, payouts, bonuses, and campaign touchpoints across multiple channels and player segments. The challenge was structuring this into metrics that are both financially accurate (GGR, NGR, hold %) and CRM-actionable (RFM segmentation, churn risk, campaign ROI).

Key reporting needs included:

  • monitoring core revenue metrics (GGR, NGR, hold %, average bet size) with monthly trend visibility
  • segmenting players by value and risk (VIP, Active, At Risk, No Deposit) using RFM scoring
  • tracking churn at a sector-standard 60-day inactivity threshold
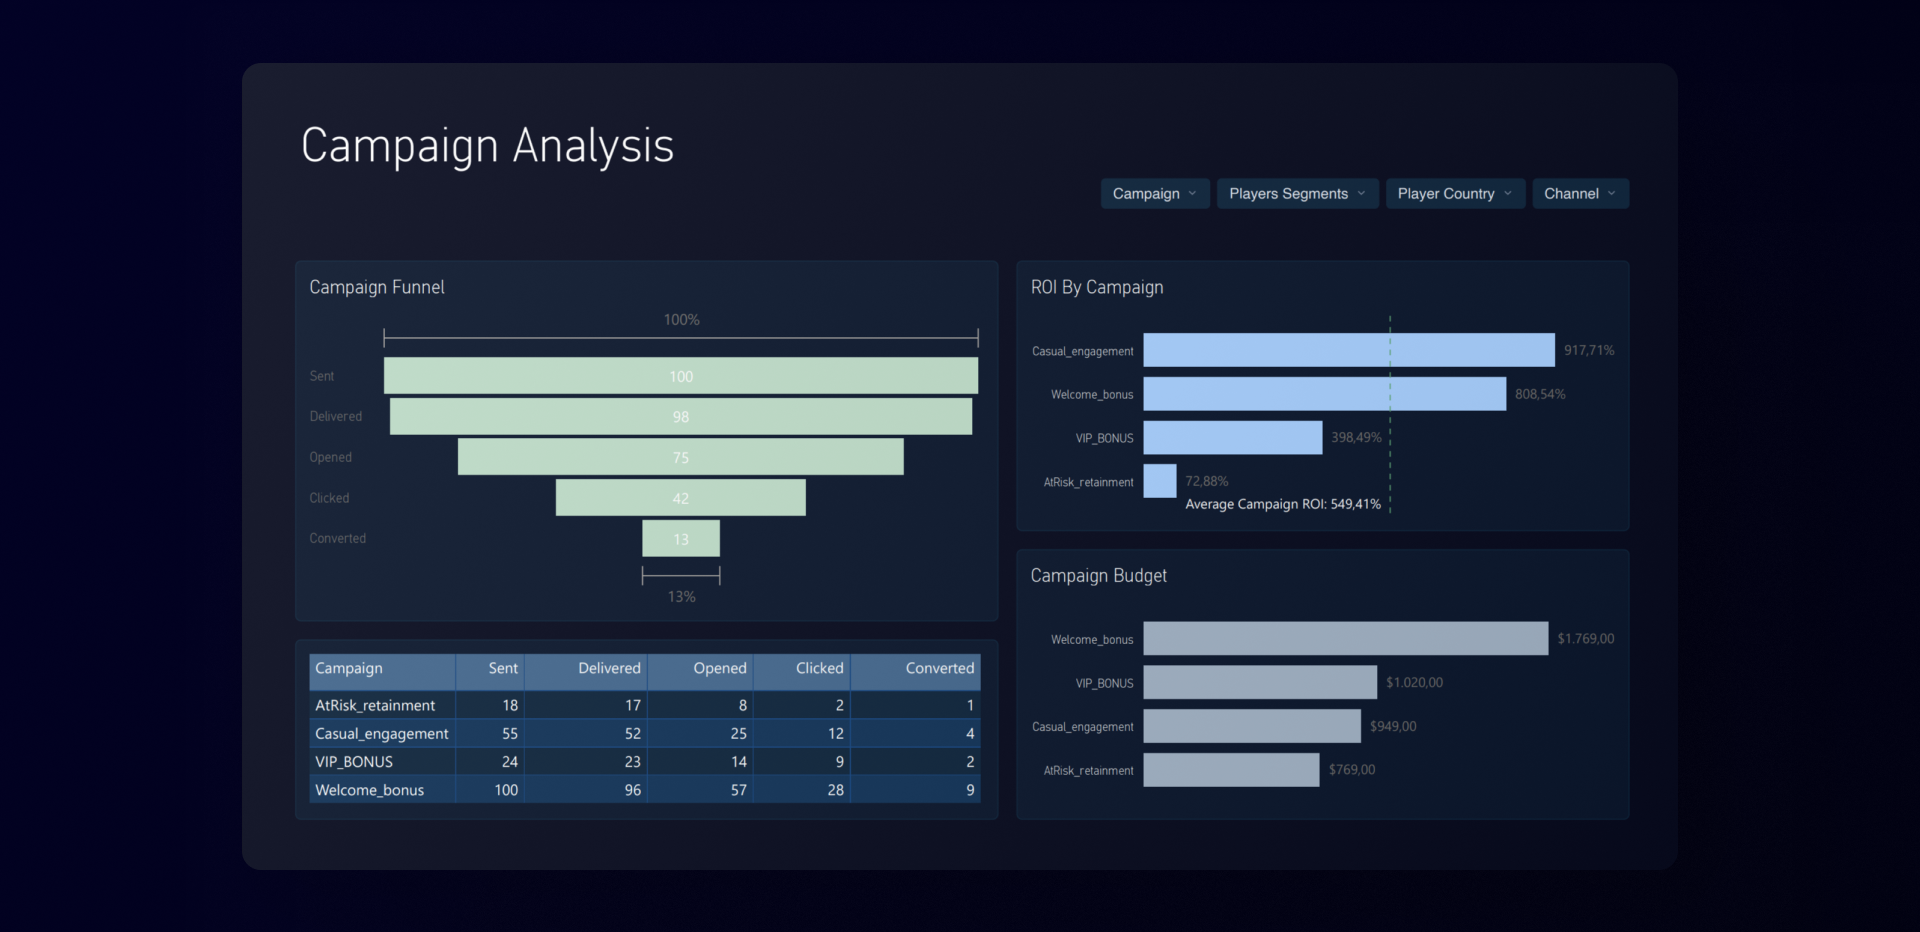
  • measuring campaign performance end-to-end, from sent to converted, with ROI by campaign
  • identifying revenue concentration by platform (mobile app, mobile browser, desktop) and geography

The dashboard had to serve both a CRM/executive audience — needing portfolio-level revenue and segment health — and a campaign-operational one, requiring funnel-level detail to evaluate individual campaigns.
My Role

I worked on the project covering the full data and analytics workflow, from raw data to dashboard:

  • designing and loading the Snowflake data model (Players, Balance, Bets, Campaigns, Bonuses, Campaign Events)
  • structuring the SQL/Snowflake analytical layer, computing core iGaming metrics (GGR, NGR, ROI, RFM scores) at source
  • designing the Power BI star schema (DimDate, disconnected funnel-stage table for stage-based analysis)
  • building the DAX measure library, including GGR recalculated at bet-level granularity for correct time intelligence
  • designing a three-page dashboard experience: Betting Activity, Player Profile, Campaign Analysis
  • translating CRM/marketing requirements into a usable, segment-driven reporting tool

The Solution

The result is a Player & Campaign Analytics Dashboard structured across three pages, each addressing a distinct CRM need.

The dashboard combines:

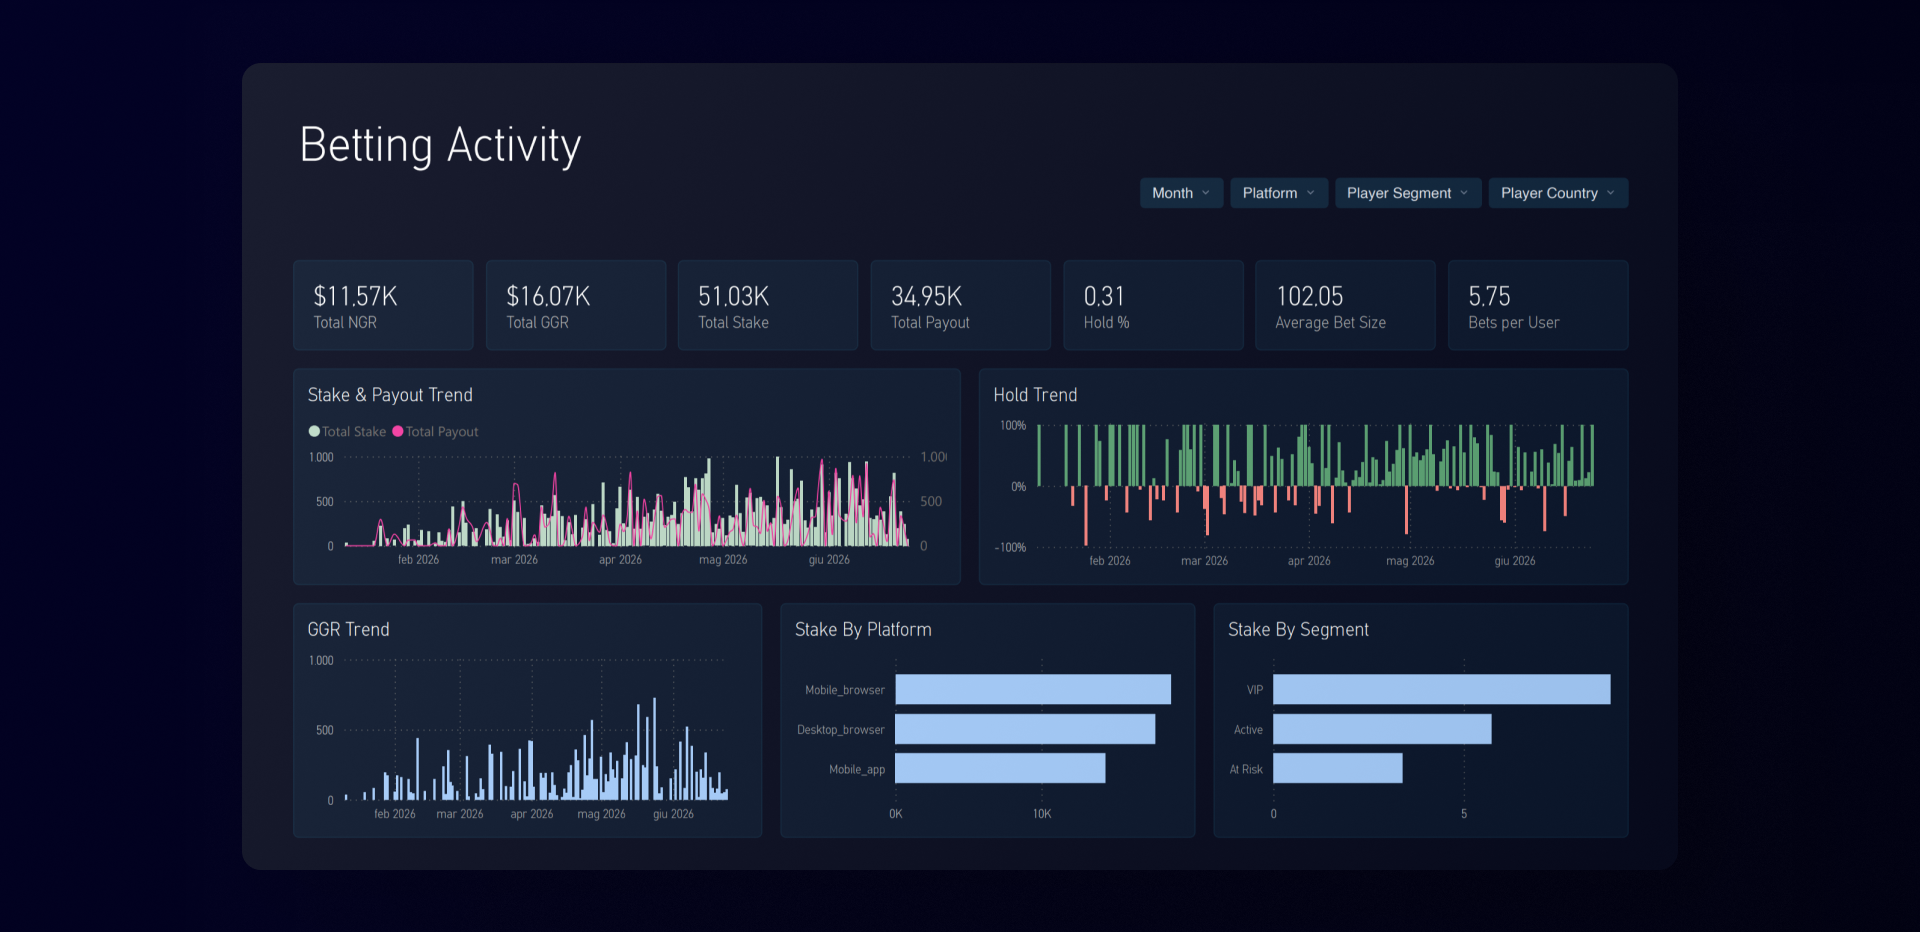
  • KPI cards for immediate revenue health (NGR $11.57K, GGR $16.07K, Hold % 0.31)
  • stake & payout trend analysis by month and platform
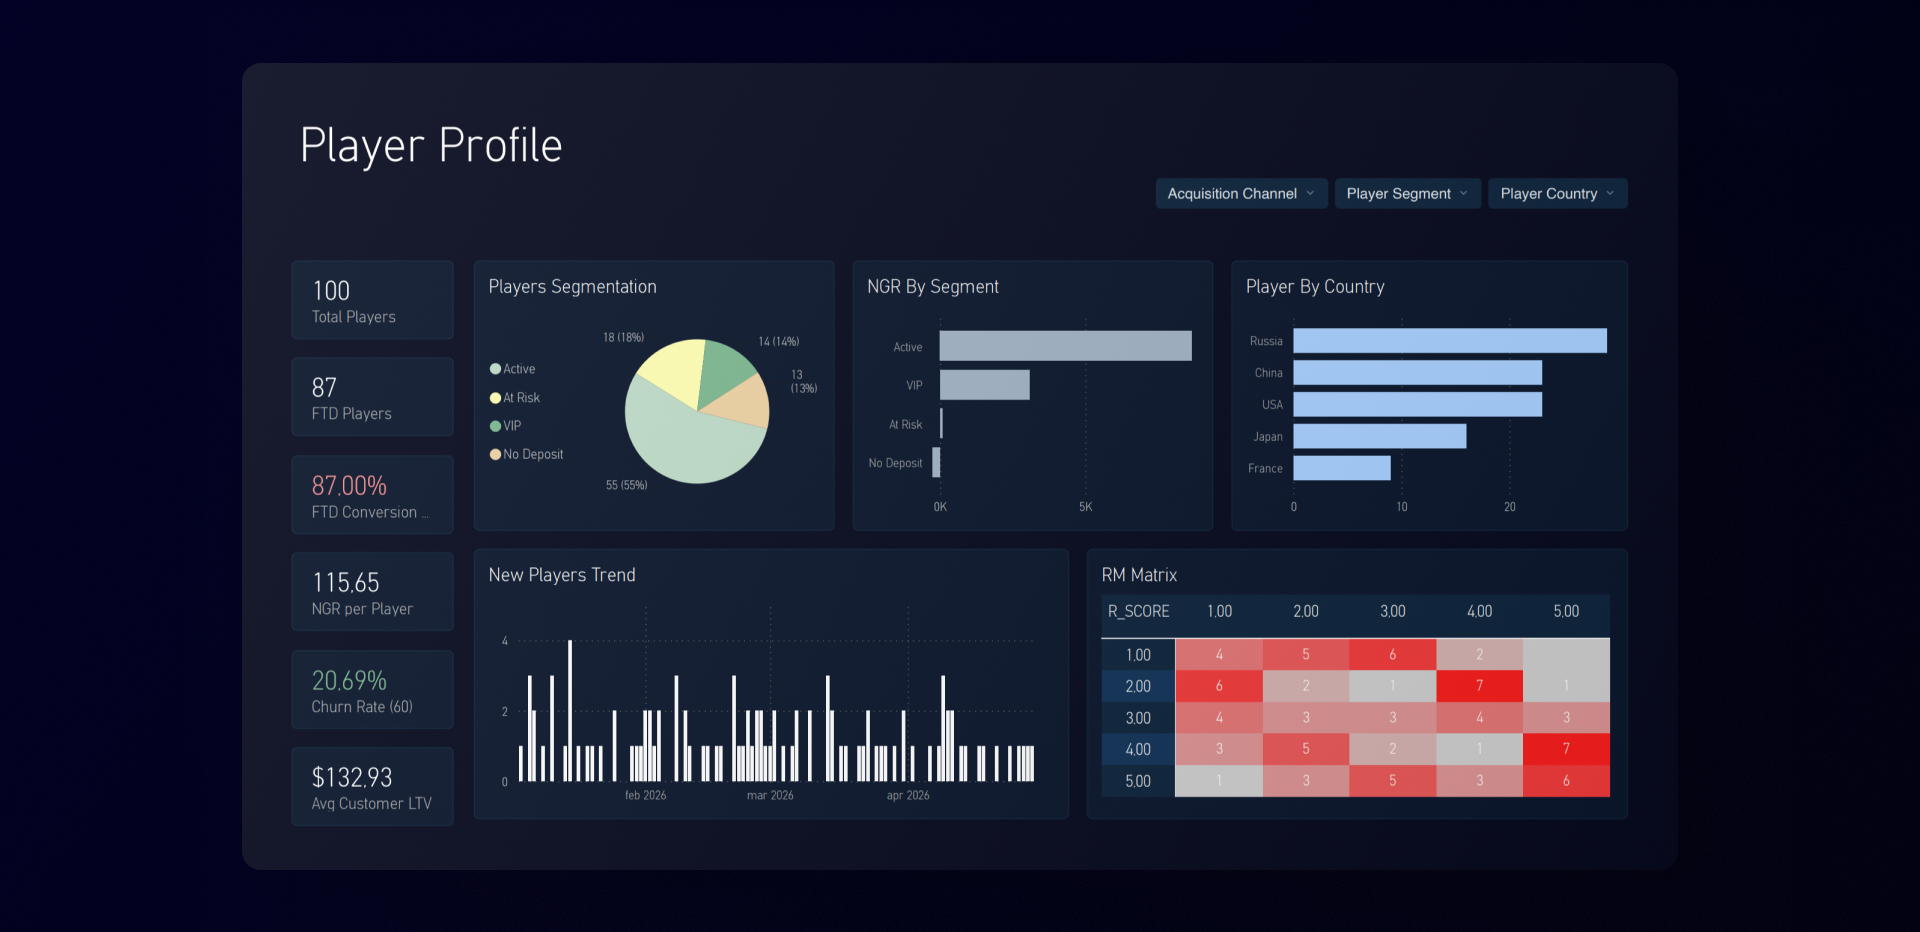
  • player segmentation (VIP, Active, At Risk, No Deposit) with RFM matrix
  • churn rate tracking (20.69% at 60-day threshold) and FTD conversion (87%)
  • campaign funnel from Sent → Delivered → Opened → Clicked → Converted
  • ROI by campaign, with budget allocation and performance comparison across 4 active campaigns

This structure allows stakeholders to move from strategic overview to operational campaign detail:
  • Which player segments drive the most NGR, and which are at churn risk?
  • Which campaigns deliver the best ROI relative to budget?
  • Where is stake concentrated by platform and geography?
  • How efficiently does the funnel convert from delivery to deposit?

Dashboard Structure

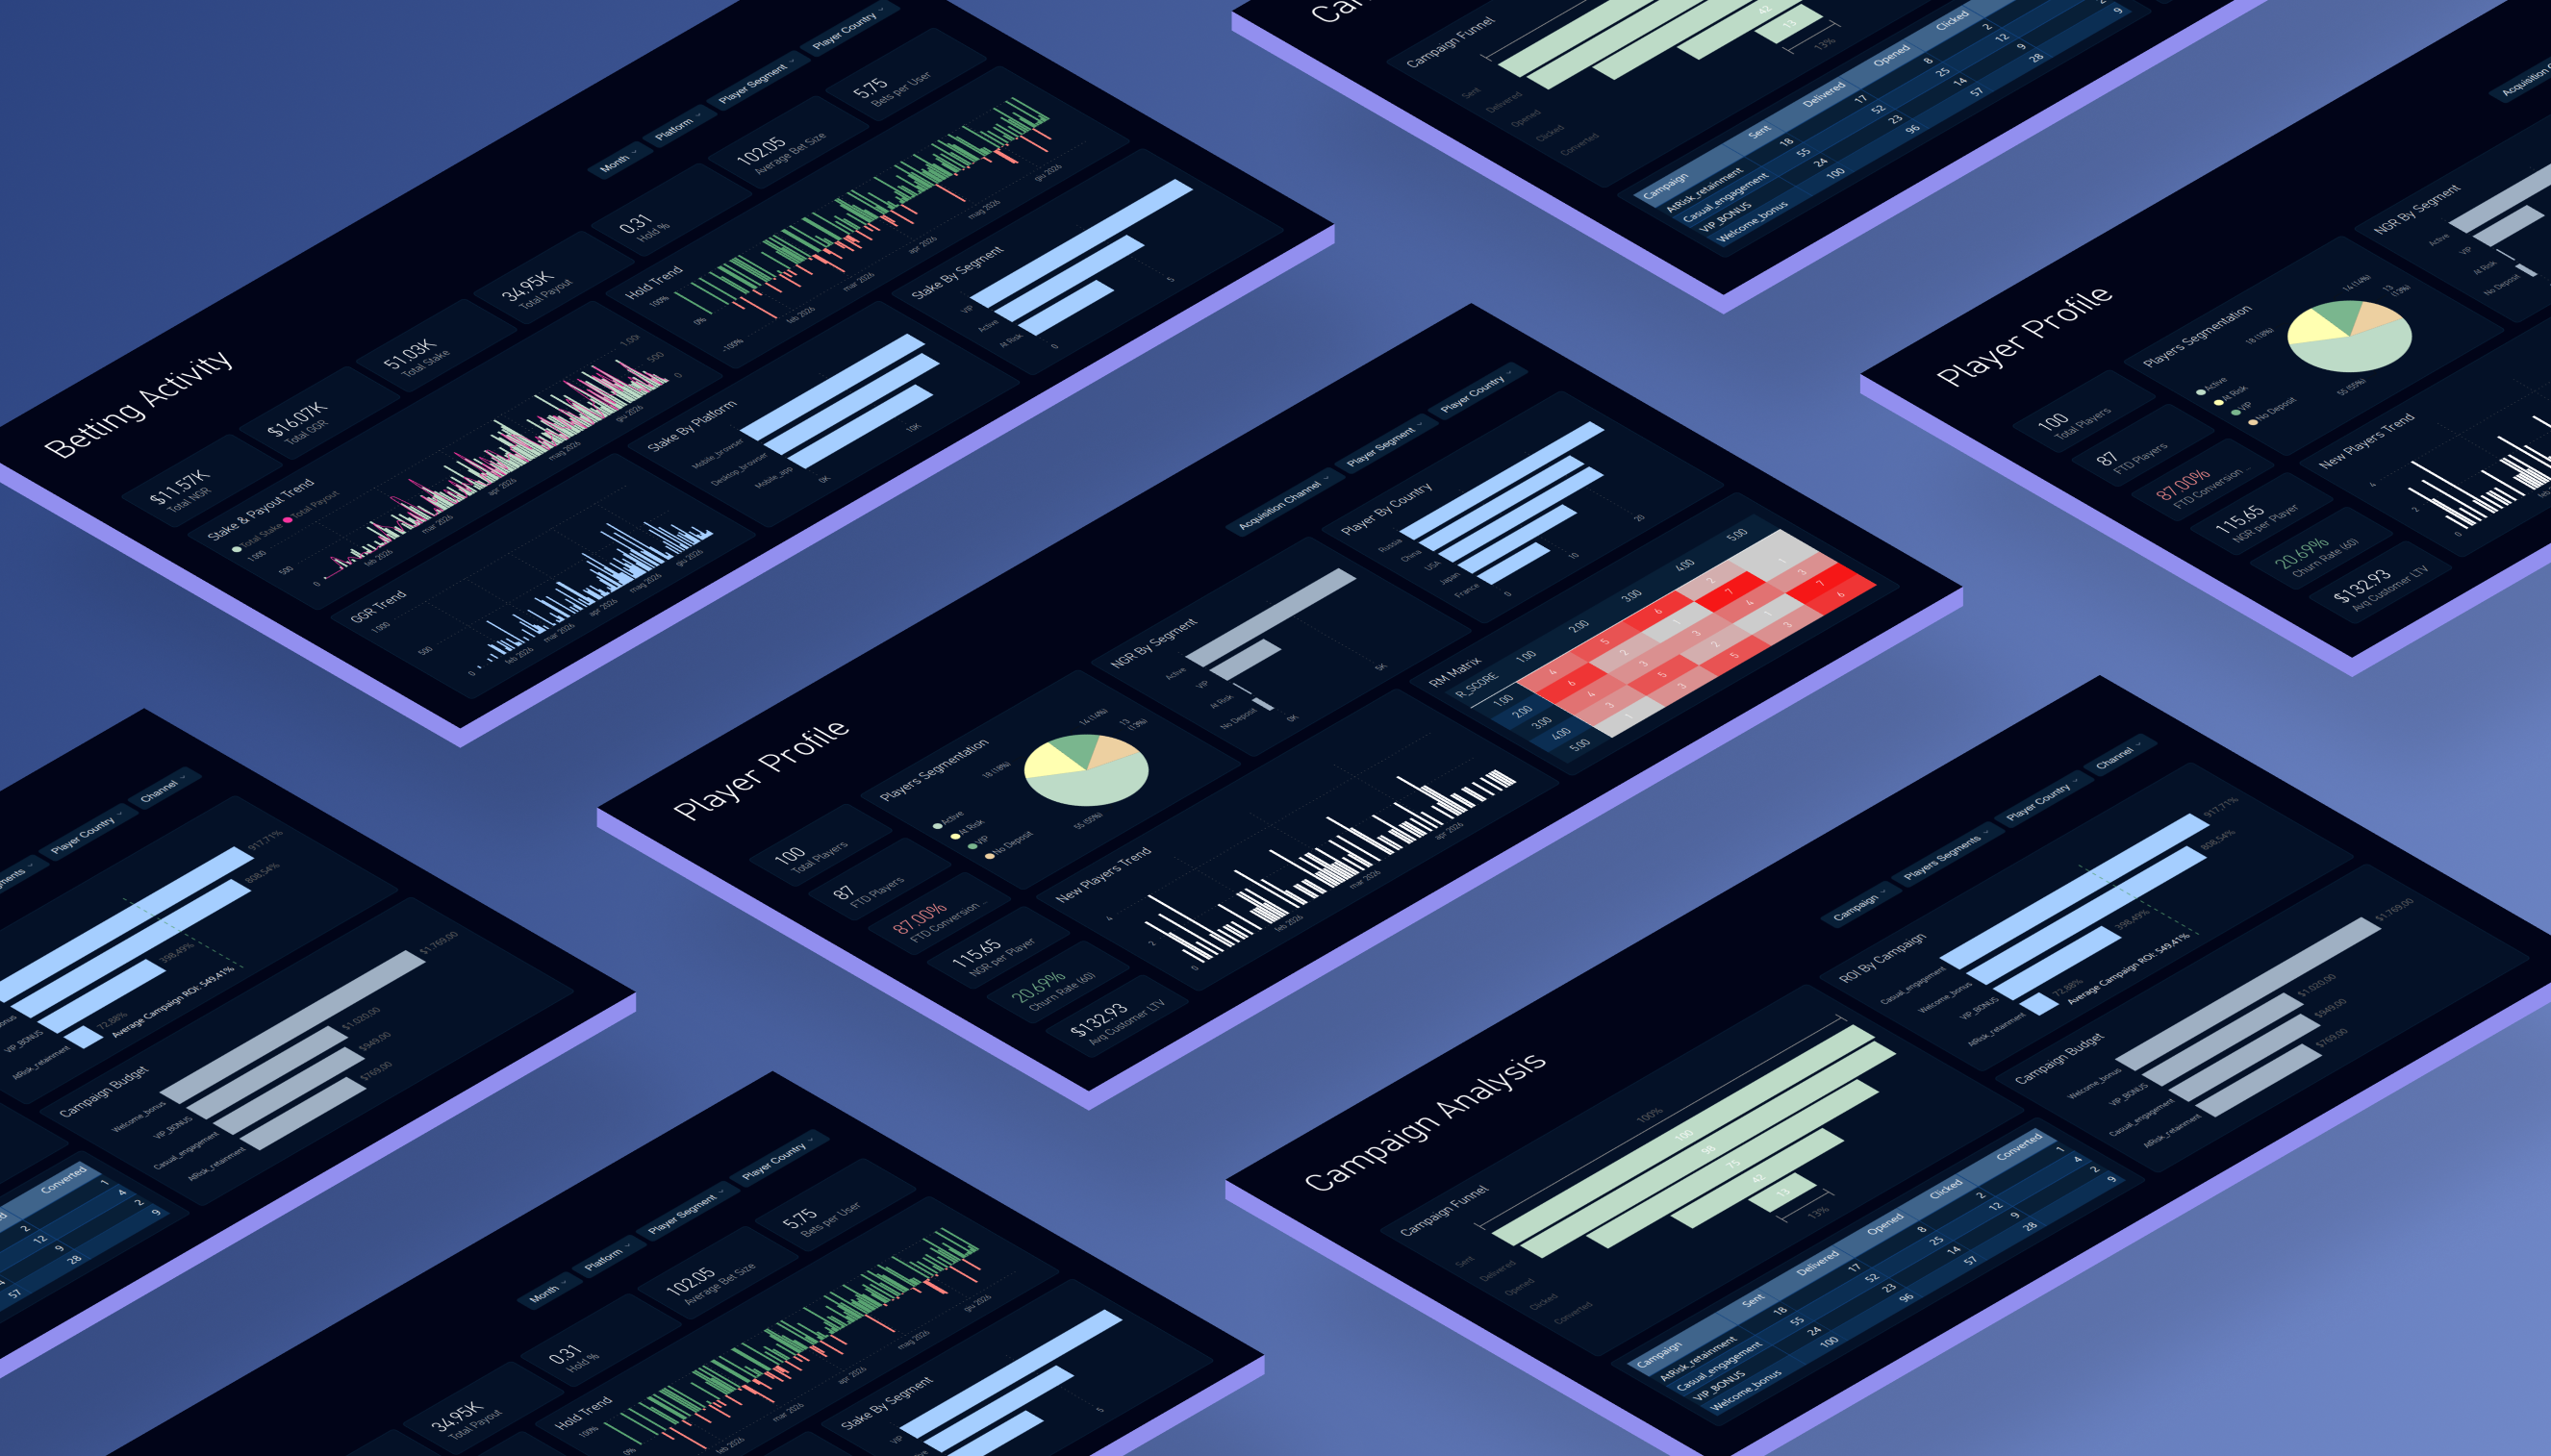
The dashboard is organized into three pages. Betting Activity provides a portfolio-level summary of GGR/NGR, stake and payout trends, and platform/segment breakdown. Player Profile scores the player base across RFM dimensions, segment distribution, LTV, and churn, enabling CRM teams to prioritize retention actions. Campaign Analysis tracks the full funnel and ROI by campaign, helping marketing prioritize budget toward high-performing initiatives.

Analytical Value

From a CRM perspective, the dashboard supports several critical decisions:

  • identifying At Risk and VIP players for targeted retention campaigns before churn occurs
  • monitoring campaign ROI to reallocate budget toward high-converting initiatives (e.g. Casual_engagement at 917% ROI vs AtRisk_retainment at 73%)
  • detecting funnel drop-off points between open and click, where most conversion value is lost
  • comparing platform performance to guide channel-specific CRM strategy (mobile app vs browser)
  • creating a shared revenue and segmentation view for CRM, marketing, and finance stakeholders

Rather than functioning as a static report, the dashboard is designed as a proactive CRM tool — built to surface at-risk revenue and high-value campaigns before budget and retention windows close.

Let's talk about your project

Have an idea or a challenge to solve? Tell me about it, and I'll personally get back to you.

LET'S WORK TOGETHER
Arrow
See More

Other Case Studies